
Short-Term Wind Energy Forecasting Using Deep Learning-Based Predictive Analytics
Noman Shabbir, Lauri Kütt, Muhammad Jawad, Oleksandr Husev, Ateeq Ur Rehman, Akber Abid Gardezi, Muhammad Shafiq and Jin-Ghoo Choi.
Abstract: Wind energy is featured by instability due to a number of factors, such as weather, season, time of the day, climatic area and so on. Furthermore, instability in the generation of wind energy brings new challenges to electric power grids, such as reliability, flexibility, and power quality. This transition requires a plethora of advanced techniques for accurate forecasting of wind energy. In this context, wind energy forecasting is closely tied to machine learning (ML) and deep learning (DL) as emerging technologies to create an intelligent energy management paradigm. This article attempts to address the short-term wind energy forecasting problem in Estonia using a historical wind energy generation data set. Moreover, we taxonomically delve into the state-of-the-art ML and DL algorithms for wind energy forecasting and implement different trending ML and DL algorithms for the day-ahead forecast. For the selection of model parameters, a detailed exploratory data analysis is conducted. All models are trained on a real-time Estonian wind energy generation dataset for the first time with a frequency of 1 h. The main objective of the study is to foster an efficient forecasting technique for Estonia. The comparative analysis of the results indicates that Support Vector Machine (SVM), Non-linear Autoregressive Neural Networks (NAR), and Recurrent Neural Network-Long-Term Short-Term Memory (RNN-LSTM) are respectively 10%, 25%, and 32% more efficient compared to TSO’s forecasting algorithm. Therefore, RNN-LSTM is the best-suited and computationally effective DL method for wind energy forecasting in Estonia and will serve as a futuristic solution.
Keywords: Wind energy production; energy forecast; machine learning
Introduction
The worldwide energy demand is increasing with every passing year so is the environmental pollution due to the brown energy generation from fossil fuels. Therefore, the uses of Renewable Energy Resources (RES) like solar and wind have gained popularity due to lower carbon emissions. However, wind energy generation is variable and unstable due to variations in wind speed [1,2]. The variable nature of wind depends on geographical area, weather, time of day, and season. Therefore, predicting wind power generation with 100% accuracy is a very difficult task [3]. However, this prediction is highly important for the management of demand and supply in power grids and also has an economic impact [4,5]. This prediction was usually made using statistical methods [6], such as moving average and autoregressive, but the accuracy of the models was relatively low. Machine learning (ML) based forecasting algorithms are a widely used tool due to their property to capture nonlinearities in the data with high accuracy, but machine learning algorithms usually require a large dataset of formation to develop an efficient forecasting model. These models are trained, validated, and tested; sometimes they still require retraining to obtain more precise results [7]. The forecasting models are usually divided into three categories, such as short-term forecasting (few minutes to 24 h), medium-term forecasting (days-ahead to week-ahead), and long-term forecasting (month-ahead to year-ahead) [8]. In this study, the real-time dataset of Estonian wind energy generation is used [9,10] for the development of these forecasting models.
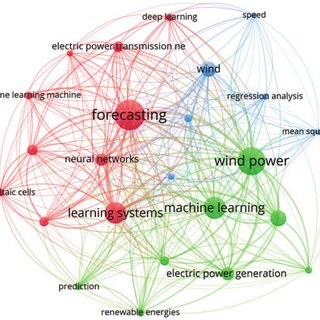
In the past, several research works have been developed using deep methods for wind speed forecasting and wind power generation forecasting. A bibliometric visualization of the keywords used in previous studies conducted in the past 5 years related to wind energy furcating has been made in VOS viewer software and depicted in Fig. 1. The figure shows the keywords used in 238 articles in the last five years related to wind energy forecasting. The forecasting of the wind speed in a university campus in Switzerland is being made using the ridge regression technique [11]. In a similar study [12], different ML algorithms like Support Vector Machine (SVM), K-Nearest Neighbor (KNN) regression, and random forest are compared for the forecasting of wind speed and corresponding energy generation for the day-ahead prediction horizon. A hybrid genetic algorithm and SVM-based algorithm are developed and tested for under-learning and overlearning scenarios of forecasting to determine the optimal solution [13]. A review of a supervised ML algorithm is made in [14]. In another work, ANN-based algorithms are developed and simulated to predict wind energy generation for grid stability [15]. A novel Cartesian genetic Artificial Neural Network (ANN) based algorithm is also proposed for wind energy forecasting in [16], which includes Hybrid regression based on SVM, Convolutional neural network (CNN), and singular spectrum analysis (SSA). The experimental results showed that SVM gave better predictions [17]. In [18], Extreme Machine Learning (ELM) algorithms have been used to forecast the wind speed for energy generation. A comparison of ELM, Recurrent Neural Networks (RNN), CNN, and fuzzy models is also given in [19–22] and future research directions are also explored. Tab. 1 provides a summary and comparison of the few known research articles related to wind energy forecasting using ML algorithms including Self-adaptive Evolutionary Extreme Learning Machine (SAEELM), Multilayer Perceptron (MLP), Random Forest (RF), Linear Regression (LR), Extremely Randomized Trees (ET), Radial Basis Function Neural Network (RBFNN), Gradient Boosting Algorithm (GBM), Tree Regression (TR), Long Short-Term Memory Networks (LSTM), Two-stream Deep Convolutional Neural Networks (TDCNN), Mean absolute percentage error (MAPE).
From all the above studies, it is clear that ML and DL algorithms are very useful in wind energy forecasting. However, it is still a very difficult thing to make an accurate prediction and a universal model is not possible. Therefore, every scenario requires a local dataset of wind speed, weather information, and location. Each model needs to be customized, built, and then trained. This accurate forecasting will help in the better management of demand and supply, smooth operation, flexibility and reliability and as well as economic implication.
In this research, a comparison has been made between different machine learning and DL forecasting algorithms for a day-ahead wind energy generation in Estonia. The historical data set on one-year Estonian wind energy generation was taken from the Estonian Transmission System operator (TSO) called ELERING [9]. This historical data contains all of the above-stated factors that affect wind energy generation. On the basis of this data, different forecasting algorithms are modeled, trained, and compared.
The key contributions of this paper are summarized as follows:
• To address the problem of wind energy forecasting in Estonia, state-of-the-art ML and DL algorithms are implemented and rigorously compared based on performance indices, such as root mean square error, computational complexity, and training time.
• A detailed exploratory data analysis is conducted for the selection of optimal models’ parameters, which proves to be an essential part of all implemented ML and DL algorithms.
• A total of six ML NAR and two DL algorithms are implemented, such as linear regression, tree regression, SVM, ARIMA, AR, NAR, ANFIS, and RNN-LSTM. All implemented algorithms are thoroughly compared with currently implemented TSO forecasted wind energy and our proposed RNN-LSTM forecasting algorithm proves to be a more accurate and effective solution based on performance indices.
Machine Learning Algorithms for Forecasting
The most common ML tool for forecasting is regression-based algorithms [19]. Regression-based learning is categorized into supervised learning algorithms that use past data sets of the parameters in the training of the model and then predict the future values of the parameters based on the regressed time lag values of the parameters, where the number of lag selections is based on observation. Moreover, the most used DL algorithms in time series prediction are RNN and CNN. In CNN, the output only depends on the current input while in RNN, the output depends both on the current and previous values that provide an edge to RNN in time series prediction. In this section, machine learning and deep learning algorithms used in this study are elaborated.
Linear Regression
This simplest and most commonly used algorithm computes a linear relationship between the output and input variables. The input variables can be more than one. The general equation for linear regression is along with its details can be found in [7].
Tree Regression
This algorithm deploys a separate regression model for the different dependent variables, as these variables could belong to the same class. Then further trees are made at different time intervals for the independent variables. Finally, the sum of errors is compared and evaluated in each iteration, and this process continues until the lowest RMSE value is achieved. The general equation and the details of the algorithm are described in [7].
Support Vector Machine Regression (SVM)
SVM is another commonly used ML algorithm due to its accuracy. In SVM, an error margin called ‘epsilon’ is defined and the objective is to reduce epsilon in each iteration. An error tolerance threshold is used in each iteration as SVM is an approximate method. Moreover, in SVM, two sets of variables are defined along with their constraints by converting the primal objective function into a Lagrange function. Further details of this algorithm are given in [7,39,40]:
Recurrent Neural Networks
The RNN is usually categorized as a deep-learning algorithm. The RNN algorithm used in this paper is the Long Short-Term Memory (LSTM) [41]. In LSTM, the paths for long-distance gradient flow are built by the internal self-loops (recurrences). In this algorithm, to improve the abstract for long time series based different memory units are created. In conventional RNN, the gradient vanishing problem is a restriction on the RNN architecture to learn the dependencies of the current value on long-term data points. Therefore, in LSTM, the cell data are kept updated or deleted after every iteration to resolve the vanishing gradient issue. The LSTM network in this study consists of 200 hidden units that were selected based on the hit-and-trial method. After 200 hidden units, no improvement in the error is observed.
Autoregressive Neural Network (AR-NN)
This algorithm uses feedforward neural network architecture to forecast future values. This algorithm consists of three layers, and the forecasting is done iteratively. For a step ahead forecast, only the previous data is used. However, for the multistep ahead, previous data and forecasted results are also used, and this process is repeated until the forecast for the required prediction horizon is achieved. The mathematical relationship between input and output is as follows [42]:
yt=w0+h∑j=1wj.g(w0,j+n∑i=1wi,j.yt−1)+εtyt=w0+∑j=1hwj.g(w0,j+∑i=1nwi,j.yt−1)+εt(1)
where wi.j,wj(iwi.j,wj(i,jj = 0, 1, 2,…, n, j = 1, 2, …, hh) are parameters for the model; n represents the input nodes, h is the number of hidden nodes. In addition, a sigmoid function is used for the hidden layer transfer function as defined in Eq. (2) [42].
sig(x)=11+exp(−x)sig(x)=11+exp(−x)(2)
Non-Linear Autoregressive Neural Network
The Nonlinear Autoregressive Neural Network (NAR-NN) predicts the future values of the time series by exploring the nonlinear regression between the given time series data. The predicted output values are the feedback/regressed back as an input for the prediction of new future values. The NA-NN network is designed and trained as an open-loop system. After training, it is converted into a closed-looped system to capture the nonlinear features of the generated output [43]. Network training is done by the back-propagation algorithm mainly by the step decent or Levenberg-Marquardt back-propagation procedure (LMBP) [44].
Autoregressive Integrated Moving Average (ARIMA)
This model is usually applied to such datasets that exhibit non-stationary patterns like wind energy datasets. There are mainly three parts of the ARIMA algorithm. The first part is AR where the output depends only on the input and its previous values. Eq. (3) defines an AR model for the p-order [45]:
yt=c+∅1yt−1+∅2yt−2+…∅pyt−p+∈tyt=c+∅1yt−1+∅2yt−2+…∅pyt−p+∈t(3)
where tt is the number of lags, Ø is the coefficient of the lag, c is the intercept term and ∈t∈t is white noise. MA is the second part that describes the regression error as a linear combination of errors at different past time intervals. Eq. (4) [45] describes the MA as follows,
yt=∈t+∅1∈t−1+∅2∈t−2+…∅p∈t−pyt=∈t+∅1∈t−1+∅2∈t−2+…∅p∈t−p(4)
The third part ‘I’ describes that the data have been updated by the amount of error calculated at each step to improve the efficiency of the algorithm. The final equation of ARIMA is as follows [45]:
yt=c+∅1yt−1+∅2yt−2+…∅pyt−p+∅1∈t−1+∅2∈t−2+,…,∅p∈t−pyt=c+∅1yt−1+∅2yt−2+…∅pyt−p+∅1∈t−1+∅2∈t−2+,…,∅p∈t−p(5)
Adaptive Neuro-Fuzzy Inference System (ANFIS)
This algorithm is a hybrid of ANN and Fuzzy logic. In the first step, Takagi and Sugeno Kang’s fuzzy inference modeling method is used to develop the fuzzy system interference [46]. The overall model in this algorithm consists of three layers. The first and last layers are adaptable and can be modified accordingly to the design requirements while this middle layer is responsible for the ANN and its training. In the fuzzy logic interference system, the fuzzy logic structures and rules are defined. Moreover, it also includes fuzzification and defuzzification as well.
This algorithm works on Error Back-propagation (EPB) model. The model employs Least Square Estimator (LSE) in the last layer which optimizes the parameters of the fuzzy membership function. The EBP reduces the error in each iteration and then defines new ratios for the parameters to obtain optimized results. However, the learning algorithm is implemented in the first layer. The parameters defined in this method are usually linear [46,47].
Exploratory Data Analysis
Estonia is a Baltic country located in the northeastern part of Europe. Most of its energy is generated from fossil fuels, whereas the RESs are also contributing significantly. The average share of fossil fuels is around 70% for the year 2019, while renewables are around 30% [9]. Although 30% is still higher as per the EU plan for renewable integration in the grid by 2020 [9]. As per the 35% share in RE, wind energy is the second most used resource in Estonia after biomass in 2019 [9], which makes it very important. The energy demand in Estonia is usually high in winter and the peak value is around 1500 MWh, while the average energy consumption is around 1000 MWh. Meanwhile, the average energy generation is around 600 MWh and the peak value is around 2000 MWh [9]. The demand and supply gap can vary between 200 to 600 MWh and is almost the same throughout the year. This gap is overcome by importing electricity from Finland, Latvia, and Russia if needed [9].
In Estonia, a total of 139 wind turbines are currently installed, mainly along the coast of the Baltic Sea [10]. Fig. 3 shows the geographical location of the installed sites. The installed capacity of these wind turbines is around 301 MW. In addition, there are 11 offshore and two offshore projects under the development phase. The plan is to have 1800 MW of wind power generation by the year 2030 [10]. The current share of wind energy is only around 10% of the total energy generated in Estonia. However, according to EU regulations, environmental factors, and self-dependency, this share will increase rapidly in the future. Therefore, due to the stochastic nature of wind speed, accurate prediction of wind power generation will be essential to manage demand and supply. A good and advanced prediction technique is required for an accurate wind power generation prediction in Estonia. This study provides a detailed and wide exploratory and comparative analysis for wind power generation forecasting by employing multiple linear and nonlinear ML and Deep Learning (DL) techniques.
The data set used in this article is the Estonian general data on wind energy generation from 1 January 2011 to 31 May 2019. The frequency of the data set is one hour. This data set for wind energy generation is highly variable due to the weather conditions in Estonia. The maximum value of wind energy production in the aforementioned period is nearly 273 MWh, the mean value is 76.008 MWh, the median is 57.233 MWh, and the standard deviation is 61.861 MWh. To demonstrate the variable nature of the time series dataset for Estonian wind power generation, the moving average and the moving standard deviation are the best tools to elaborate on this dynamic nature of the dataset. Fig. 4 shows the wind energy production data along with the moving average and the moving standard deviation from Jan. 2018 to May 2019. It is clear from Fig. 4 that there are no clear peaks in wind energy or low seasonal values. Wind energy production is variable throughout the whole year. As indicated by the moving average, wind energy generation is high in winter (November to March), but even in that time, its value drops for a few weeks and then again increases.
The histogram and the probability density function (PDF) of the data are shown in Fig. 5a, which indicates that the wind energy production is below 50 MWh most of the time and its value rarely goes above 250 MWh. The histogram data is now normalized to compute the actual probability of different energy production values. The resultant probabilities are depicted in Fig. 5b. These probability values also indicate the same analogy. For example, the probability of getting 100 MWh energy is around 20% and 250 MWh is only around 3%. Therefore, the accuracy for the prediction of peak power generation or above-average power generation is a challenging task. Further analysis of this data set is performed using autocorrelation analysis. Fig. 5c shows the autocorrelation analysis of the data set.
In time-series analysis, the autocorrelation measure is a very useful tool to observe the regression nature of the time-series data and provides a birds-eye view for the election of the number of lags if any regression-based forecasting model is employed. It is the correlation of the signal with its delay version to check the dependency on the previous values. In this graph, the lag of 20 h is shown, in which the lags up to the previous 16 h have a regression value above 0.5 percent and after which it drops significantly below 0.5. The confidence interval is identified by the calculated 2 values. The correlation decreases slowly over time, which shows long-term dependency. The description of this observation is described in [48]. However, the autocorrelation of wind energy generation does not decrease rapidly with weather changes related to different seasons. This exploratory data analysis helps us to estimate design, and parameter selection for all ML and deep-learning algorithms defined earlier.
Forecasting of Wind Energy
The Estonian wind energy dataset has been used in this research. The dataset is then divided into training, testing and validation and the divisions of data are 80%, 10% and 10%, respectively. All these simulations are carried out in Matlab2021a in a Windows 10 platform running on an Intel Core i7-9700 CPU with 64 GB RAM. Initially, the training data was converted into standard zero mean and unit variance form to avoid convergence in the data. The same procedure was carried out for the test data as well. The prediction features and response output parameter has also been defined for a multistep ahead furcating. The Estonian TSO is responsible for the forecasting of wind energy generation on an hourly basis. Their prediction algorithm forecasts wind energy generation 24 h in advance. It also generates the total energy production and the anticipated energy consumption. Fig. 6 shows the values of wind energy production and the values forecasted by the TSO algorithm for May 2019 [49].
Most of the time, the actual energy generation is much higher than the forecast values. The gap can go up to 70 MWh, which is too much. The forecasting algorithms need to be more accurate than that. This variation can falsely tell the energy supplier to use alternative energy sources rather than wind. This may be fossil fuel or any other resource, which will cost more to the supplier and eventually the customer. This low accuracy allowed us to study, develop, and propose a comparatively suitable forecasting algorithm for the prediction of wind power generation in Estonia.
In this study, the emphasis is on the accurate prediction of wind energy generation in Estonia. Eight different algorithms based on machine learning and DL are simulated and tested using the 1-year wind energy generation data set for a day-ahead prediction horizon. The results of all employed algorithms are compared based on RMSE values. Fig. 7 shows the comparison of actual wind energy generation and the forecast wind energy generation of TSO for 31 May 2019. It is clear from the figure that there is a substantial gap between the original and predicted values. The RMSE value for TSO forecasting is 20.432. The forecasting of all algorithms is tested on the same day as shown in Fig. 8.
Results and Discussions
The wind power generation data understudy has a highly nonlinear nature; therefore, a vast variety of linear and nonlinear forecasting algorithms need to be tested to find an appropriate option. A thorough comparative analysis is conducted to compare the accuracies of all forecasting algorithms employed in this paper. Machine learning algorithms, such as linear regression, AR, ARIMA, and tree-based regression, are not performed adequately, while SVM is given good forecast accuracy.
On the contrary, deep-learning algorithms, such as NAR and RNN, have a high degree of accuracy compared to all other algorithms employed as the architectures for both algorithms have the capability to capture nonlinear features of the data. However, the ANFIS also gives relatively low accuracy. The ML algorithms are not showing accuracy as the data is highly non-linear and therefore the ML algorithms do not perform better curve fitting and result in lower accuracy as compared to DL methods.
DL models, in contrast, due to the ANN fitted the curve better and therefore gave more accurate forecasting results. Thus, these results indicate that for this time series-based forecasting the efficiency of DL methods is higher as compared to ML methods. The comparative analysis of ML algorithms and DL algorithms based on the RMSE value is depicted in Tab. 2. In addition, to the best of the author’s knowledge, this study is the first comprehensive comparative analysis between the know ML and DL algorithms for wind power generation data in Estonia.
Furthermore, it is pertinent to mention that this energy forecasting topic has been under investigation for decades. The main issue is still the accuracy of forecasting. The main focus is to forecast wind energy on the basis of past data and not wind speed. Some researchers have tried to develop some hybrid models as well. However, it is extremely difficult to compare the results of these studies with our study as there are many parameters involved like the size of the dataset, location, time span, and then the algorithm used.
In this study, the best results are shown by the RNN-LSTM algorithm. The algorithm consists of 100 hidden units in the LSTM layer. This number of hidden units is obtained by the hit and trial method, the numbers are varied from 20 to 250. The models showed the best results for 100 units and after that, the results remained almost the same. It is using historical data only. Therefore, the number of features is one and the response is also one. The training of the algorithm is carried out by an ‘ADAM’ solver and the number of Epochs was also varied from 50–250 epochs. When the whole data set passes through the back or forward propagation through the neural network then it is called an Epoch. Learning rate is used to train the algorithm and when a certain number of Epochs are passed then it is dropped to a certain value. The initial learning rate was defined as 0.005. The gradient threshold is also one. The simulation parameters are described in Tab. 3.
In order to make multistep predictions, the prediction function makes a forecast of a single time step; and then updates the status of the network after each prediction. Now, the output of the first step will act as the input for the next step. The size of the data is also varied and tested between 1 month and 96 months to observe its impact on the forecasting algorithm. The simulation results show that after the data size is more than 24 months, the performance of this algorithm does not affect. Almost, the same RMSE value is obtained for 36, 60, and 96 months. The comparison is shown in Tab. 4. The RMSE values and the corresponding training time are also shown in Tab. 4.
Fig. 9 shows the compression of actual wind energy production of TSO, the forecasted production and our algorithm for May 2019. It is clear from the graph that RNN-LSTM is providing better forecasts throughout the month. The RMSE value of the TSO furcating is 25.18 while the RNN forecasting is 15.20 for the whole month. Fig. 10a shows the error of both the TSO forecasting algorithm and the proposed RNN-LSTM algorithm. It is also clear from the graph that TSO’s forecasting error is higher. The TSO’s algorithm predicts a small variation in output energy well but fails when there are large fluctuations. On the other hand, RNN-LSTM is forecasting the large functional well but sometimes does not work that well with continuous low values of energy prediction. Therefore, a hybrid of both algorithms can be proposed here that will overcome both the low and high fluctuation. The results are shown in Fig. 10b. The error in forecasting is also depicted here. The error in forecasting is quite low now as is observed from the graph. The RMSE value for this hybrid forecasting is 8.69.
Conclusions
In the past decade, ML and DL have become promising tools for forecasting problems. The highly nonlinear behavior of weather parameters especially wind speed makes it a valid challenging problem to use ML and DL algorithms for wind energy forecasting for smart grids. Moreover, an accurate time-series forecasting algorithm can help provide flexibility in modern grids and have economical and technical implications in terms of demand and supply management and for the study of power flow analysis in power transmission networks. In this paper, six ML and two DL forecasting algorithms are implemented and compared for Estonian wind energy generation data.
Wind energy accounts for approximately 35% of total renewable energy generation in Estonia. This is the first attempt to provide an effective forecasting solution for the Estonian energy sector to maintain power quality on the existing electricity grid. We target the day-ahead prediction horizon, which is the normal practice for the TSO forecasting wind energy model. Real-time year-long wind energy generation data are used for the comparative analysis of the ML and DL algorithms employed. Moreover, the results of all employed models are also compared with the forecasting results of TSO’s algorithm. The comparison of all ML and DL algorithms is based on performance indices, such as RMSE, computational complexity, and training time. For example, the results for May 31, 2019, illustrated that TSO’s forecasting algorithm has an RMSE value of 20.48. However, SVM, NAR, and RNN-LSTM have lower RMSE values. The results conclude that SVM, NAR, and RNN-LSTM are respectively 10%, 25%, and 32% more efficient compared to TSO’s forecasting algorithm. Therefore, it is concluded that the RNN-LSTM based DL forecasting algorithm is the best-suited forecasting solution among all compared techniques for this case.

AI in shipping: areas to watch in 2020
Editor’s note: This is a re-post of an article from ship-technology.com
The buzz around artificial intelligence continues to proliferate, with shipping companies beginning to explore AI’s potential in predictive maintenance, intelligent scheduling and real-time analytics. Here is a round-up of five specific areas set to benefit from artificial intelligence in 2020.
Automated processes at shipping terminals
The shipping industry is growing in confidence at AI technology’s capacity to run processes at container terminals and expects it to play a big role in operations in the near future.
In a survey by Navis, 83% of respondents expect to increase their investment in AI technologies within the next three years. A large proportion of participants also agreed that AI could be involved in automating processes at terminals, such as container handling equipment assignments (81%), decking systems (81%), recommended actions (69%), predicting gate volumes (59%), and stowage of vessels (52%).
Approximately 56% said they were either trialling technologies or carrying out research into AI capabilities. However, there is some way to go yet as just 11% confirmed they were already using AI in some capacity in terminal operations.
As for what they anticipate the biggest challenge to be with AI, 68% stated that it was a lack of skills in the technology. While around a third said there was a lack of cases that had proven the advantages for business. But as the technology is still relatively new, this is hardly surprising.
Although the survey asked a relatively small pool of 60 Navis customers, this can be taken as an indication that the industry is giving serious consideration to what AI has to offer.
In a separate development, Kawasaki Kisen Kaisha (K Line) has started a project to research into AI’s capabilities to improve the quality of shipping services. The research is being carried out in collaboration with fellow Japanese organisations Hiroshima University, Marubeni Corporation and the National Institute of Maritime, Port and Aviation Technology (MPAT). The project will use predictive models for maritime logistics and market conditions.
Reducing fuel consumption

Next year, Stena Line is rolling out an AI platform to cut fuel consumption on its fleet of ships.
Since 2018, the company has been experimenting with AI tech on the Stena Scandinavica ferry, which travels overnight from Gothenburg in Sweden to Kiel, north Germany. The company has been collaborating on this project with tech firm Hitachi.
These tests have proven that the platform can provide fuel savings of up to 3%.
The Stena Fuel Pilot AI software is able to predict the most economical route in terms of fuel consumption. Factors such as weather, currents, and other variations potential problems are taken into account and then the most efficient route is recommended.
The company has a set a target of cutting fuel consumption and carbon emissions by 2.5% per annum. Of Stena’s total running costs, 20% is spent on fuel. By the end of 2020, Stena Line plans to install the AI software on 38 of its vessels throughout Europe.
One of the most complex factors to predict is water currents, which Stena hopes to make possible by refining the AI technology. Stena’s ultimate ambition for AI is to create a system so precise that the captain can use it to plan routes in total confidence.
Stena Line aims to be fully AI-assisted in 2021. Areas where the company is already being supported by AI include administration, customer service and finance.
Image recognition systems
AI is being used for ship image recognition systems as part of a collaboration between Chinese tech company SenseTime and Japanese shipping firm Mitsui OSK Lines (MOL).
SenseTime’s system uses ultra-high-resolution cameras and a graphic processing unit (GPU) to automatically identify vessels in the surrounding area. It is intended to help improve safety and help stop large vessels colliding with smaller ones. It can also provide alerts to other hazards, particularly when visibility is poor. The image recognition technology could be used to monitor shipping lanes, as well as for security and coastguard operations.
The Chinese company developed the graphic recognition engine by combining AI deep-learning technology with MOL’s extensive maritime experience. The system automatically collects image data, which MOL intends to use to refine the precision of the technology.
The system has been tested this year onboard MOL’s passenger line cruise ship, Nippon Maru. MOL plans to try the solution on other vessels as the company explores the development of autonomous smart ships.
SenseTime is currently one of the world’s leading AI start-ups. Previously, the company teamed up with Honda to develop self-driving cars. However, SenseTime’s products are unlikely to be launched in the US any time soon. The start-up has been added to the US Government’s Entity List due to national security concerns, amid the Trump administration’s trade war with China.
Navigation systems
Navigation is one obvious area with potential for AI use in shipping and a number of systems are currently in development. Some use elements of image recognition and tracking software, alongside IoT connectivity. AI can be used to analyse multiple navigation scenarios.
Orca AI is one such AI navigation platform being developed. The company’s solution combines sensors and cameras with deep learning algorithms. It is able to locate and track other vessels on the water and take action to avoid collisions.
Meanwhile, Wärtsilä subsidiary Transas’ Navi-Planner is an AI platform that uses machine learning to optimise voyage planning. Safe navigation routes are automatically created according to the latest charts and environmental information available. It records any near-misses and other incidents that occur during voyages. The system will also be able to adjust routes and speeds to ensure arrivals take place on schedule.
Not surprisingly given its heavy focus on AI, Stena Line has also developed its AI Captain solution for ship navigation. It is able to recalculate routes during voyages when it receives information to say there is an issue with the present route.
Unmanned vessels

Perhaps the ultimate goal for artificial intelligence in shipping is to enable vessels to operate unmanned. This is expected to take a leap forward in 2020.
In September, the Mayflower Autonomous Ship (MAS) will leave Plymouth in the UK and head across the Atlantic to Massachusetts, US. It will be a very similar route to the one taken in 1620 by the first European settlers in the US, exactly 400 years previously.
The difference this time is that there will be no crew onboard, with tech making decisions on route planning and hazard avoidance. The trimaran vessel will use equipment such as radar, GPS, cameras, satellites, sensors and LIDAR for the voyage, with AI systems provided by IBM. A deep-learning system will enable data gathering and analysis during the voyage.
In case of an emergency, the ship can make a satellite call back to the UK for assistance. MAS will get its power from solar and wind, with a diesel engine for backup.
Elsewhere in the industry, Yara Birkeland is an automated container ship being developed by Kongsberg and Yara. It is also fully electric.
Yet one of the biggest issues with automated ships is economics. The sheer amount of tech required for a fully automated container ship isn’t going come cheap. The Yara Birkeland is estimated to cost around $25m, which is three times higher than a container vessel of equivalent size. Furthermore, with no-one on board, it could make them a target for opportunist pirates.

AI On Cruise Ships: The Fascinating Ways Royal Caribbean Uses Facial Recognition And Machine Vision
Editor’s note: This is a re-post of an article from Forbes.
In the travel industry, the primary use cases for artificial intelligence (AI) and machine learning technologies revolve around improving customer experiences.
Chatbots, in particular, have proven popular across this industry, with natural language processing (NLP) applied to the challenges of dealing with customer inquiries and providing personalized travel experiences.
Alongside this, recommendation engines power the most popular online travel portals such as Expedia and Trivago, combining customer data with information on millions of hotel vacancies and airline flights worldwide.
However, when it comes to operators, compared to other industries such as finance or healthcare, the travel industry as a whole is at an early stage when it comes to organization-wide deployment of smart, self-learning machine technology.
One industry leader that is bucking this trend, though, is cruise operator Royal Caribbean Cruises. In recent years, the world’s second-largest cruise operator has put AI to use to solve several problems.
As far as customer experience is concerned, the overriding goal has been to remove the “friction” often experienced. Until recently, this was seen as an inevitable consequence of having to check in a large number of passengers at a single departure time, rather than deal with a continuous flow of guests arriving and departing, as at a hotel or resort.
The company’s SVP of digital, Jay Schneider, tells me “Our goal was to allow our customers to get ‘from car to bar’ in less than 10 minutes.
“Traditionally it would take 60 to 90 minutes to go through the process of boarding a ship, and as a result, people didn’t feel like they were on vacation until day two – we wanted to give them their first day back.”
A vital tool in achieving this aim was the deployment of facial recognition technology. It uses computer-vision equipped cameras that can recognize travelers as they board, cutting down the need for verifying identity documents and travel passes manually.
This could have been done by providing customers with wearables such as a wrist band; however, the decision was taken to eliminate the need for external devices by using biometric identifiers – faces.
“We wanted to get people on their vacations as quickly as possible, and we didn’t want to have to ship every passenger a wearable – we want you to use the wearable you already have, which is your face.”
Computer vision-equipped cameras are built into the terminals that customers interact with as they board, and sophisticated algorithms match the visual data they capture with photographic identification which is submitted before their departure date.
AI doesn’t stop improving customer experience once guests are on board. Several other initiatives are designed to make passengers more comfortable or help them make the most of their time. These range from personalized recommendations for how they should spend their time on board, to monitoring and managing footfall as people move around the boat and queue to make use of services.
These monitoring systems are also powered by computer vision, but rather than recognizing individual faces, they monitor the build-up of bodies as passengers move about, allowing congestion to be detected and dealt with where necessary.
The technology for this application was built in partnership with Microsoft, and involved retro-fitting existing CCTV cameras with smart technology. This avoided the need for ships to be taken out of action while the entire camera network was upgraded with computer vision cameras.
“We have massive ships – we didn’t want to take them out of service, gut them and put sensors in, so we worked with Microsoft to understand how we could leverage our existing and somewhat antiquated CCTV cameras.
“Microsoft was a great partner … we threw our data scientists at the problem, and we’ve been able to take old cameras, as well as fisheye cameras, and detect humans through the use of AI.
“There’s a ton of use cases – it gives us information on things like table turnover times in restaurants, and we’re going to start using it from this summer to alert crew members when lines are backing up.”
This will mean crew can be redeployed in real time to wherever their services are in demand.
Another initiative is aimed at cutting down on food that goes to waste on board cruise liners. With 65,000 plates of food served daily aboard the vessel Symphony of the Seas, AI helps make decisions about how much food should be stocked to ensure guests don’t go hungry while keeping wastage to a minimum.
“We like to think we’re probably the most sustainability-friendly cruise line – and one of the things we’ve focused on when deploying AI is working towards our goals of improving sustainability. Outside of the cost savings, and improved freshness of the food we serve, it has sustainability benefits … we’ve seen a reduction in food waste as a result of this pilot,” says Schneider.
The most recent application – which began trials just weeks ago – is Royal Caribbean’s chatbot, styled as a virtual concierge, which allows passengers to ask questions about their voyage, destinations, or how they should spend their time on board.
“The whole idea, again, is to pull people out of lines – we don’t want passengers waiting in line at guest services to get questions answered, we want them to be able to get the information they need right away,” Schneider tells me.
The chatbot employs NLP and machine learning to understand what the most commonly asked questions are, and become more efficient at providing personalized answers. It uses a “human-in-the-loop” model, meaning that if it can’t work out what a customer wants, a human customer service agent is paged into the conversation. The NLP algorithms are then capable of learning how they could have tackled the question, by monitoring the human agent’s response.
With this, as with its other AI initiatives, Royal Caribbean follows a model of carefully monitored, small-scale trial deployments, before individual initiatives are put into organization-wide use.
Schneider tells me “We believe we get the best results with this method … test, adjust, scale … rather than ‘ready, fire, aim’ – which the rest of our industry seems to do! So, once we’ve carefully tested it and we’re sure it’s ready to go, we will scale it.”
When it comes to gathering data, cruise operators like Royal Caribbean are in a unique position, as they effectively function as hotels, food and beverage providers, supply chain and logistics operations, shipping operators and entertainment and gaming companies, all rolled into one.
This means customer journeys can be tracked and data gathered across all of these functions, enabling a holistic approach to data-driven customer service.
“As you can imagine,” Schneider says, “there are any number of opportunities … we’ve focused on yield management in cabin occupancy … the list goes on.
“We’re focused on testing, adjusting and scaling examples of where we can use AI to change the customer and the crew experience. Not everything has been successful, but the vast majority have shown early signs of success, and we’ve been extremely thrilled with the results so far.”

Determining the Scope Of An IT Project
Technology solves many business issues, make sure you have the right IT consultant for the job.
How to Define the Scope of Your IT Project
Customized software development means juggling many responsibilities such as:
- Setting goals and milestones
- Identifying the right resources for each task
- Determining project requirements
- Managing change
- Performing a needs assessment
Successful IT project management is the culmination of implementing the right best practices with the art of time management. Knowing the scope of your project is a critical step and it all starts with a thorough IT environment assessment. Whether your project is an office move, a structured cabling job, a cloud migration, or a customized inventory management platform, knowledge is key. Armed with information, you can determine the scope of the project by answering the following:
- What are the requirements? This determines what features and functions are required. What needs to be specifically built into the solution?
- What are the process requirements? Not only is it important for the solution to function a certain way on its own, but the scope will touch on existing processes as well. Data is never static, it flows from one point to another.
- Who are the stakeholders? People are as important to the solution as the solution itself. When important stakeholders are left out of the development process, it may be impossible for them to buy in once the solution is finished.
- What are the limitations? Scope isn’t all about what is included, it is about what needs to be excluded as well. Often it is important to document what will not be done to better define expectations.
- How will change be managed? Once scope is defined, it can’t be changed without the right change management functions taking place. The time to define how change will be handled is at the very beginning
MOBIZ will make sure you have the right answers to these questions so your project gets off on the right start. But what if you already have an IT provider? In some cases, your managed service provider may be more of an impediment than a vehicle for success.
When Custom Software Development Is Beyond the Scope of Your Managed MSP
Defining the scope of your IT project is critical because one of the main determining factors to success is having the right people and resources available. If you are using a managed services provider they simply might not be equipped to handle your project.
Most MSP’s Simply Maintain a Baseline of Support
Managed service providers are usually doing two things, monitoring infrastructure such as email servers, workstations, patching, and networks, and incident remediation like responding to outages and cyber attacks. An MSP that has actual programmers on staff is a rare thing which means if something comes up with a client they are usually forced to find another option
Managed Service Providers Will Suggest Their Own Provider
When presented with a high-level It project, an MSP may understand the solution but not have the resources to carry it out. This is very common for projects like structured cabling and web design. While the MSP may handle some low-level tasks, anything that is part of a large project is usually left to a third party.
Specialized Solutions Require a Specialized Provider
When you have an IT project, there is no need to rely on options that fall short. MOBIZ is the specialized It provider your business needs to make sure your IT project has the best chance of success.
AT MOBIZ, we’re here to help you tackle the big-picture tasks. Whether you want to upgrade your servers, tighten network security, or move your data to the cloud, large IT projects require a business to invest time and capital in the management of these projects. MOBIZ can create a roadmap and strategy for delivering critical projects properly and without any disruption to your day-to-day IT operations.

What is Infrastructure as a Service?
As your business considers migrating to the cloud, think about Infrastructure as a Service.
Infrastructure as a Service – Delivering Without Physical Servers
Infrastructure as a Service (IaaS) describes a common delivery model for cloud services where businesses rent or lease servers for computing power or storage in the cloud. With IaaS, a user can run any operating system or application they want and through cloud delivery they can ignore maintenance and operating costs. This makes IaaS delivery much more efficient and cheaper to run for an enterprise as opposed to owning and operating its own network infrastructure. Other benefits?
- Cost Savings – The most important reason businesses choose IaaS is cost. When infrastructure is provided at an as-needed basis, businesses no longer need to plan for expanded abilities in the future in order to satisfy the needs of the present. IaaS also reduces maintenance and service costs.
- Easier Scaling – A business looking to add capability quickly to take advantage of a new business opportunity, expand to a new market, or to handle exponential growth will need additional network resources to handle more users and more data. IaaS can quickly scale resources up or down depending on demand and immediate needs.
- Disaster Recovery – With cloud services operating in multiple locations, businesses can access data and applications during outages or to recover from disasters. IaaS can be combined with automated procedures to ensure consistent data backups making recovery very quick and simple.
- Test Environments – New applications can be tested without adding the additional infrastructure needed to support it.
How is IaaS Different From Other Cloud Delivery Models?
Of the three most common cloud delivery options, IaaS models allow for the most customization. The enterprise leases only the hardware (networking equipment, data center space, storage, and physical servers) but maintains all other components of the technology such as applications, data, operating systems, etc. This allows the enterprise to establish total control over how the network is being used without having to purchase or own the actual hardware used to access it.
Software as a Service (SaaS)
This model has the cloud provider managing the entire technology stack while the subscriber pays a monthly fee to access software through the cloud. While this may be a good option for smaller enterprises, it may not be a viable long term option for large enterprises needing control of resources.
Platform as a Service (PaaS)
This model expands on SaaS to include a platform that incorporates the operating system, middleware, and runtime. The subscriber can still choose what applications they run and this model generally is more of a scalable option.
We Make Sure You Get the Most out of the Cloud
At MOBIZ, our goal is to make sure you do business better and when you are ready to leverage all the benefits the could has to offer, we’ll be there with expert services and advice designed specifically to your needs. How?
Content Delivery – Cloud platforms are perfect vehicles for delivering applications to diverse teams, especially those in different geographical locations. We can help keep your teams connected around the country while ensuring they don’t have any performance issues.
Monitoring and auditing – IaaS is never a static solution, it needs to be monitored and assessed periodically to make sure it is satisfying networking needs. And because security is always a concern, the MOBIZ team is available to assist you in keeping you data and applications safe.
Scaling – One of the greatest benefits of IaaS is its ability to scale as your business scales. But while this seems like a simple management issue, knowing how and when to scale is extremely important. Through expert traffic monitoring and by leveraging our established relationships with cloud providers, you will never be left in the dark or hampered by unexpected downtime.
Testing – Expansion is never easy and the same goes for your network infrastructures. Growth management needs to include the use of technology and with Iaas you not only get a scalable network tool, but the opportunity to test expanded networks. This gives you the capability to catch any issues and plan for them well before they go live.
If your enterprise is considering cloud computing, reach out to MOBIZ today. We can help you unlock the potential of IaaS and plan for a successful transition.

Things to Consider When Expanding Your Network
This blog will discuss how you can prepare for IT growth as your business expands.
Your IT Network: A Careful Balance
All businesses seek growth, but in our experience it’s surprising how many are unprepared to handle increased burdens on their technology and the networks that support it. Network capacity and capabilities should be able to handle the needs of the present while keeping costs under control but flexible enough to be able to expand to take advantage of opportunities in the future.
When a business has a forward-thinking IT strategy, it’s better equipped to handle steady growth and sudden changes in the market. This is why small and medium businesses call on IT consulting experts like MOBIZ to move their networks where they need to be at such a crucial time. So much focus, resources, and planning are spent on other parts of the business that a trusted IT partner like MOBIZ can help alleviate additional capacity while also establishing a solid plan for the future.
Before you undertake any network expansion or revision project, here are some questions MOBIZ will help you answer:
Why Are You Expanding?
This may be the easiest to answer, but it’s extremely important because it will define the approach. Have you experienced sudden growth beyond projections? Are you expanding into new markets and new locations? Do you need to replace older equipment that is beyond its useful life? By answering these questions, we can help you turn a weakness into a strength
How Well Will Your Current Wireless Network Handle Increased Load?
Adding users and additional computers also adds pressure to your computer network. At the beginning of any engagement, MOBIZ puts your network through a number of rigorous tests that are proven to give an accurate measurement of the exact capabilities of your network, where it’s weak, and what needs to be done to further develop and improve it.
Who Will Need Access to the New Network?
Access permissions are important for businesses that handle sensitive information. Compliance is essential, but even if essential information isn’t regulated, any network audit takes control and access into account. Certain folders or passwords may need to be restricted and file ownership processes may need to be reviewed if employees move to different departments or leave the company altogether. Network security needs to be assessed and improved accordingly.
What Programs and Applications Will Be Critical for Future Growth?
Some applications you’ve been using may have been chosen solely on price. These kinds of temporary measures can restrict growth, especially when inadequate applications have been accepted as the norm. On the other hand, there is no reason to overpay for programs you don’t need. This is where a technology expert can help you assess what you use, how you use it, and where it will be in the next few years.
Do You Have a BYOD Policy?
Companies that allow employees to use their own phones, tablets, and laptops for work find it can make expanding capacity easier and cheaper. But this can also create serious document security issues if an employee loses their device or if they leave the company. While informal policies may work in the beginning, a formal bring your own device (BYOD) policy that is continually reviewed and updated helps answer crucial questions about how these devices and the sensitive information that is on them should be handled.
How MOBIZ Network Consulting Can Evolve to Managed Services
The final question is who will manage your new network, and this is where MOBIZ can provide the best value. As consultants, we’ve solved network issues for dozens of businesses at the enterprise level, expanding their global reach and developing a tool that will help them build measured, sustained growth. With added capacity comes added responsibilities, and we’re here to help manage and monitor your networks long past the initial project.
Benefit From Our Experience
There are plenty of things to worry about when guiding your business—your technology shouldn’t be one of them. Call us today for more information about MOBIZ and to schedule a network assessment. Our thorough IT environment assessment is a strategic, top-down picture of how your business works and how technology is used to complete your most important business processes. Our technicians can get to the root of any issue and provide solutions that last, not just temporary fixes.

The Crucial Differences Between IT Consulting and Managed Services
A managed services provider may be a more hands-on technology partner, guiding your decisions and fitting their solutions to your needs. But some companies don’t need that level of engagement and when you need expertise for a project, IT consulting is the way to go.
IT Consulting Vs. Managed Services, Which is Right for You?
For a business needing outside IT help, the choices can be daunting. There are so many companies out there that offer customized solutions to IT needs and other services, it is difficult to know where to start. Fortunately MOBIZ is a different kind of technology company.
This blog will explore the differences between IT consulting and managed services, what situations are right for each, and how MOBIZ combines the two to create a lasting technology partner that will help any business lower costs, improve operations, and do business better.
Managed Services
When done on your own, technology can be expensive. Not only do you need to hire and train the right people, but your department has to be the right mix of ongoing support for day to day operations and planning for growth. Both are equally critical to the success of your business but for organizations with limited means, it is extremely difficult to accomplish both at the same time.
A managed services provider is a company that is contracted to perform either as an extension of your existing IT department or as your entire IT department. They can manage IT infrastructure and end-user systems or concentrate on specific goals such as compliance, security, infrastructure as a service, or proactive risk assessment. They are more concerned with day to day operations but the right provider can also provide vCIO services and IT assessments that help you plan for the future. This advice is usually tempered along the lines of the services they already provide and while isn’t necessarily a bad thing, it does hamper your ability to choose what you want.
IT Consulting Services
A consultant is an advisor that is more concerned with how to use IT in such a way that will address their current business goals and find solutions for specific issues. A consultant is called when you have a project that needs to be completed or a company has grown to where they need strategic guidance for their IT and related infrastructures in response to growth or industry changes. For example, a company may need to connect warehouses through a custom-built intranet, a consultant would provide the technical expertise so a solid plan can be developed and carried out.
IT consulting is more about advising and helping their clients modernize with the real-world tools they need to meet immediate and future issues. The consultant investigates an issue or a need, analyzes the best outcome, and develops a plan that can be implemented by the client alone or with further outside help.
At MOBIZ, we are consultants that thrive on a challenge and by leveraging our extensive expertise with the latest technology, we can ensure you get the IT solutions you need to compete.
How MOBIZ Combines the Two
Throughout our company history, MOBIZ has developed our IT partnerships by solving our clients immediate needs. We are consultants that thrive on a challenge and by leveraging our extensive expertise with the latest technology.
Traditional managed services model will handle the day to day responsibilities for you, but MOBIZ is different. We’re here to help you tackle the big-picture tasks. Whether you want to upgrade your servers, tighten network security, or move your data to the cloud, large IT projects require a business to invest time and capital in the management of these projects.
Once the work is done, you may find that the company that built your custom solution is the one that is best equipped to help you manage it. This is how we can combine the project mentality of a consultant with the managed security an MSP has to offer.
What are your IT challenges? Reach out to MOBIZ today and let’s get them solved.